Management’s discussion and analysis
Key factors determining the Group’s financial profit or loss
In 2016 the Group generated a gross profit of PLN 7.3 million versus PLN 42.9 million in 2015. The net profit amounted to PLN 2.5 million, as compared to 33.9 million a year before.
The key changes in income statement items:
Net profit of the Bank Pocztowy Capital Group in 2016 (PLN million)
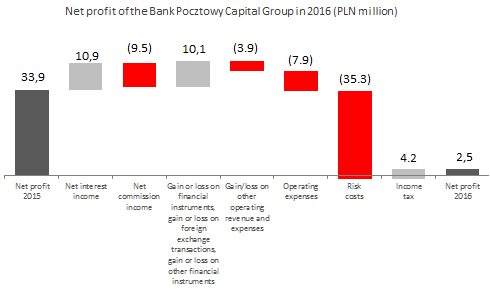
The financial performance of the Group in 2016 was adversely affected by the following one-off events:
- recognition in the net fee income and other operating expenses of additional provisions in the amount of PLN 6.2 million and PLN 3.9 million, respectively, for potential claims resulting from pending proceedings instigated on 4 December 2015 by the President of the Office for Competition and Consumer Protection with respect to inappropriate method of informing clients of changes in the Regulations and the Fees and Commissions and additional charges introduced by the Group and relating to bank statements distributed by the Group for the period from July to December 2015 and in 2016,
- writing off IPO expenses incurred in 2015 and 2016 of PLN 3.2 million and charging them to other operating expenses,
- recognition of a provision for termination benefits under non-competition agreements with Members of the Management Board of the Bank of the 9th term of office of PLN 2.4 million,
- payment to the Bank Guarantee Fund under Resolution of BFG Management Board no. 308/DGD/2016 of 28 October 2016 in the amount of PLN 0.8 million for payment of guaranteed funds to depositors of Bank Spółdzielczy in Nadarzyn.
The total impact of non-recurring events in 2016 was PLN 16.5 million.
The key item adversely affecting financial performance of the Group in 2016 was higher impairment losses on loans and advances, which grew by PLN 35.3 million during the year and reached PLN 100.5 million in 2016. This item increased significantly because additional impairment losses were recognized for the portfolio of cash loans and installment loans for years 2013-2016. In case of this group of loans, which is highly promoted by the Bank, a 80% growth in impairment losses amounted to PLN 42.9 million. The credit policy, pricing policy and management decisions made in the past did not sufficiently hedge the Group’s credit risk.
On the other hand, the event which positively affected the financial performance of the Group was the settlement of the sale of shares in VISA Europe Limited. The Group generated related revenue of PLN 16.9 million.
Moreover, apart from one-off events, which considerably increased the expenses, the profit of the Group was affected by the following factors:
- The increase in the net interest income, despite record low interest rates. In 2016 the net interest income amounted to PLN 267.7 million, i.e. was by 4.2% higher than the same time last year. The increase resulted mainly from adjusting the deposit offer to the market situation and the increase in the sales volume of consumer loans.
- Apart from the aforementioned provision of PLN 6.2 million, the decrease in the net fee and commission income of PLN 9.5 million resulted from a lower number of bank accounts on which maintenance fees are charged, stemming from a decrease in the number of accounts maintained by the Group and conversion of bank accounts to ZawszeDarmowe accounts which are maintained free of charge.
- A gain on other revenue and operating expenses lower by PLN 3.9 million. The decrease resulted from the adverse non-recurring events discussed above which increased other operating expenses.
- A growth in administrative expenses of PLN 7.9 million, which resulted mainly from the increase in personnel expenses stemming from the growth of base pay of sales network employees (a new career path introduced in the second quarter of 2015) and recognition of provisions for costs of non-competition agreements with Members of the Management Board of the 9th term of office. Non-personnel expenses were additionally increased by the tax on certain financial institutions introduced in February 2016, which amounted to PLN 4.8 million in 2016.
Significantly, in line with the Group’s estimates, the net profit of the Group, adjusted by the impact of the increase in impairment losses on loans and advances and negative one-off events would amount to PLN 40 million.
The key income statement items:
| Key items the income statement of the Bank Pocztowy S.A. Capital Group (PLN’000) | ||||
|---|---|---|---|---|
| Change 2016/2015 | ||||
| 2016 | 2015 | PLN ‘000 | % | |
| Operating income | 339 081 | 327 528 | 11 553 | 3,5 % |
| Net interest income | 267 696 | 256 822 | 10 874 | 4,2 % |
| Net fee and commission income | 47 727 | 57 190 | (9 463) | (16,5)% |
| Dividend income | 18 | - | 18 | - |
| Gain or loss on financial instruments measured at fair value through profit or loss and gain or loss on foreign exchange transactions | 3 395 | 1 789 | 1 606 | 89,8 % |
| Gain or loss on other financial instruments | 20 245 | 11 727 | 8 518 | 72,6 % |
| Gain/loss on other operating revenue and expenses | (6 375) | (2 461) | (3 914) | 159,0 % |
| General and administrative expenses | (224 898) | (217 030) | (7 868) | 3,6 % |
| Net impairment losses | (100 496) | (65 158) | (35 338) | 54,2 % |
| Operating profit/loss | 7 312 | 42 879 | (35 567) | (82,9)% |
| Gross financial profit/loss for the current period | 7 312 | 42 879 | (35 567) | (82,9)% |
| Income tax | (4 802) | (8 948) | 4 146 | (46,3)% |
| Net financial profit/loss for the current period | 2 510 | 33 931 | (31 421) | (92,6)% |
Net interest income
In 2016, the net interest income constituted the key source of income for the Group. It reached PLN 267.7 million and was by PLN 10.9 million, i.e. 4.2% higher than in 2015.
Group's income (PLN million)
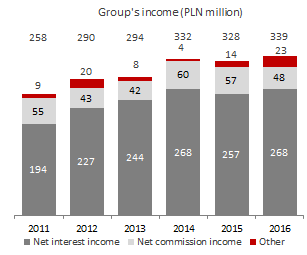
In 2016 the net interest income increased, while the interest income and interest expense of the Group decreased, i.e.:
- Interest income, which in 2016 amounted to PLN 348.6 million were by PLN 5.2 million, i.e. 1.5% lower than in 2015. The decrease resulted mainly from lower income on investment financial assets held to maturity, which, in turn, resulted from a decrease in the portfolio value which was reported when the Group no longer purchased new debt securities qualified to the portfolio. This item amounted to PLN 9.5 million and was by 41.9% lower than in 2015. The interest income on loans and term loans granted to institutional clients and local government institutions also decreased by 17.9% and 19.1%, respectively, when the balance of loans decreased because the Group had followed the policy of reducing lending to these clients. Additionally, interest income on overdrafts dropped by 28.7%, because the overdraft volume had decreased.
- In 2016 interest expense amounted to PLN 81.0 million and was by PLN 16.1 million, i.e. 16.6% lower than in 2015. In 2016 the Bank adjusted its pricing policy concerning deposits to lower market interest rates, therefore the Group incurred much lower interest expense due to term deposits of all groups of clients.
| Interest income and interest expense of the Bank Pocztowy S.A. Capital Group (PLN’000) | ||||
|---|---|---|---|---|
| Change 2016/2015 | ||||
| 2016 | 2015 | PLN ‘000 | % | |
| Interest income | 348 647 | 353 887 | (5 240) | (1,5)% |
| Income on receivables from banks | 4 773 | 4 914 | (141) | (2,9)% |
| Income on loans and advances to clients, including: | 313 217 | 313 812 | (595) | (0,2)% |
| Overdraft facilities | 2 999 | 4 209 | (1 210) | (28,7)% |
| Credit facilities and term loans | 310 218 | 309 603 | 615 | 0,2 % |
| individuals | 282 625 | 275 875 | 6 750 | 2,4 % |
| institutional clients | 21 779 | 26 540 | (4 761) | (17,9)% |
| local government | 5 814 | 7 188 | (1 374) | (19,1)% |
| Income on investments in financial assets classified as: | 30 657 | 35 089 | (4 432) | (12,6)% |
| available for sale | 21 159 | 18 729 | 2 430 | 13,0 % |
| held to maturity | 9 498 | 16 360 | (6 862) | (41,9)% |
| Income on financial assets held for trading | 0 | 72 | (72) | (100,0)% |
| Interest expense | (80 951) | (97 065) | 16 114 | (16,6)% |
| Expense due to liabilities to other banks | (56) | (1 125) | 1 069 | (95,0)% |
| Expense due to liabilities to customers, including: | (54 923) | (73 287) | 18 364 | (25,1)% |
| Current accounts | (10 490) | (16 975) | 6 485 | (38,2)% |
| Term deposits | (44 433) | (56 312) | 11 879 | (21,1)% |
| individuals | (37 457) | (46 370) | 8 913 | (19,2)% |
| institutional clients | (6 683) | (9 489) | 2 806 | (29,6)% |
| local government | (293) | (453) | 160 | (35,3)% |
| Costs due to highly liquid and subordinate bonds and subordinate loan | (24 562) | (20 384) | (4 178) | 20,5 % |
| Costs arising from repo and sell-buy-back securities | (1 246) | (2 141) | 895 | (41,8)% |
| Costs related to hedging instruments | (164) | (128) | (36) | 28,1 % |
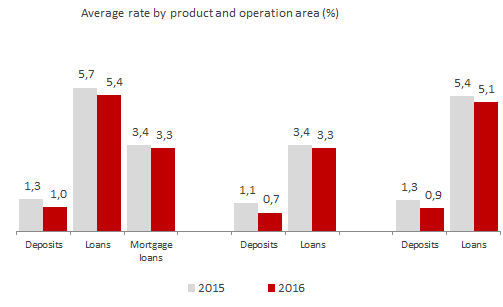
Average rate by product and operation area (%)
Group's net interest income (PLN million)
Interest margin (%)
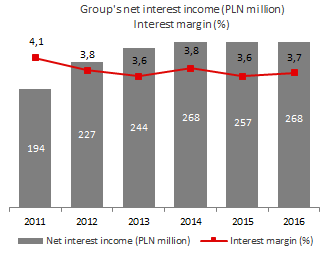
As a result of a higher net interest income in 2016 the Group reported a 0.1 p.p. increase in the net interest margin versus 2015. In 2016 the net interest margin amounted to 3.7%, i.e. much more than the average margin in the banking sector (2.3%).
Net fee and commission income
Net fee and commission income was the key element of non-interest income of the Group. It amounted to PLN 47.7 million and was by 16.5% lower than in the previous year.
| Fee and commission income and expense of the Bank Pocztowy S.A. Capital Group (PLN’000) | ||||
|---|---|---|---|---|
| Change 2016/2015 | ||||
| 2016 | 2015 | PLN ‘000 | % | |
| Fee and commission income | 93 109 | 101 063 | (7 954) | (7,9)% |
| settlement and cash transactions | 45 637 | 45 401 | 236 | 0,5 % |
| okeeping bank accounts | 16 316 | 25 221 | (8 905) | (35,3)% |
| payment and credit cards | 19 978 | 19 520 | 458 | 2,3 % |
| sale of insurance products | 3 371 | 3 412 | (41) | (1,2)% |
| investment fund services | 2 445 | 1 667 | 778 | 46,7 % |
| originated loans and advances | 874 | 1 097 | (223) | (20,3)% |
| other | 4 488 | 4 745 | (257) | (5,4)% |
| Fee and commission expense | (45 382) | (43 873) | (1 509) | 3,4 % |
| keeping current accounts and term deposits | (17 718) | (18 071) | 353 | (2,0)% |
| cash card services, payments made in ATM and POS | (14 541) | (12 853) | (1 688) | 13,1 % |
| cash and settlement services provided to Group entities | (8 110) | (7 916) | (194) | 2,5 % |
| other services | (5 013) | (5 033) | 20 | (0,4)% |
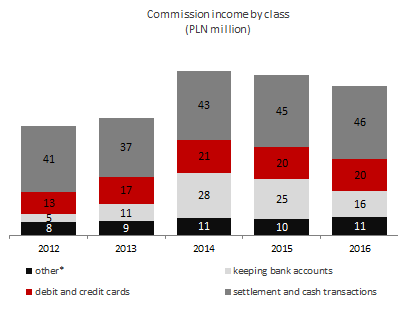
Commission income amounted to PLN 93.1 million and was by 7.9% lower than in 2015.
The Group reported lower income from bank account maintenance (by 35,3%). The decrease resulted from:
- recognition of additional provisions in the amount of PLN 6.2 million for potential claims resulting from pending proceedings instigated on 4 December 2015 by the President of the Office for Competition and Consumer Protection with respect to inappropriate method of informing clients of changes in the Regulations and the Fees and Commissions and additional charges introduced by the Bank and relating to bank statements for 2016,
- a decrease in the number of bank accounts on which maintenance fees are charged stemming from a decrease in the number of accounts maintained by the Group and conversion of bank accounts to ZawszeDarmowe accounts which are maintained free of charge.
At the same time, the Group increased the sale of investment fund units and made the offer more attractive, hence the Group increased the revenue from sale of investment funds by 46.7%. The revenue from payment cards and credit cards increased as result of a higher number of ATM cash withdrawals.
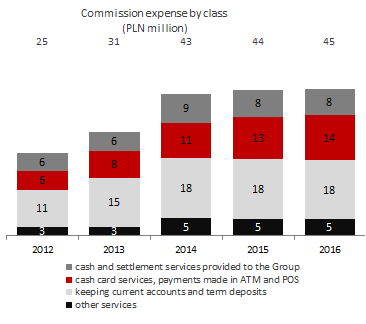
In 2016 the fee and commission expense increased as well up to PLN 45.4 million, being 3.4% higher than in 2015. The Group saw an increase in the fee and commission expenses resulting from:
- an increase in the number of card transactions made by clients as a result of the growing popularity of card transactions resulting from the widespread contactless payments for small amounts and the development of the network of readers and terminals. The number of non-cash transactions made using debit cards grew by 72.8% and the number of proximity card transactions by 56.7%. The costs of payment card services, payments made in ATMs and POSs were by 1.7 million, i.e. 13.1% higher than in 2015.
Commision income by class
(PLN million)
Commision expense by class
(PLN million)
* Other commission income included: income from sale of insurance products, investment funds management, originated loans and advances, and other income. In 2010 and 2011 the consolidated financial statements did not account for adjustment of bancassurance income. The Group decided to not disclose these items for data comparability reasons.
Other income
In 2016 the gain on financial instruments measured at fair value through profit or loss, gain on foreign exchange transactions and gain on other financial instruments amounted to PLN 23.6 million versus PLN 13.5 million reported in 2015.
In 2016 the Group reported a net investment income of PLN 20.2 million, i.e. by PLN 8.5 million higher than the same time last year. The improvement resulted from income from the sale of shares in VISA Europe Limited (“VISA Europe”). On 21 June 2016, the transaction involving acquisition of Visa Europe by Visa Inc. was concluded. Following its settlement including amendments to original transaction terms, the Bank has received the following consideration for its share in Visa Europe:
- EUR 2,787 thousand in cash,
- 1,011 preference C series shares convertible to ordinary A series shares in Visa Inc.,
- a share in deferred payment of 0.0214748639% of the amount earmarked for this purpose (EUR 1.12 billion) subject to a provision that the amount may be adjusted. The deferred payment will be receivable three years of the transaction closing. Therefore, when recognizing this portion of the consideration, the Bank has applied a 2% discount to be brought forward until the date of receiving the related funds.
The total consideration arising from acquisition of Visa Europe by Visa Inc., recognized in consolidated income statement of the Group amounted to PLN 16,872 thousand and included:
- PLN 12,244 thousand in cash,
- PLN 3,592 thousand of income from preference C series shares convertible to ordinary A series shares in Visa Inc.,
- PLN 1,036 thousand of income from the Group’s share in the deferred cash payment.
At the end of 2016 the gain on financial instruments measured at fair value through profit or loss and a gain on foreign exchange transactions amounted to PLN 3.4 million versus PLN 1.8 million reported in 2015. The highest increase was reported in derivative transactions. The gain on foreign exchange transactions amounted to PLN 3.1 million and was by PLN 0.6 million higher than in 2015.
In 2016 other operating income (other revenue/operating expenses) amounted to PLN (6.4) million as compared to PLN (2.5) million at the end of 2015. Other operating income amounted to PLN 3.6 million and was by PLN 1.1 million lower than in 2015, mainly as a result of lower income from reimbursement of costs of collections (under proceedings before court and amounts collected by debt collectors).
In 2016 other operating expense amounted to PLN 10.0 million and was PLN 2.8 million higher than in 2015. As discussed above, the costs of additional provisions for possible future liabilities arising from the pending proceedings instigated by the President of the Office for Competition and Consumer Protection and the costs of writing off receivables (IPO expenses of PLN 3.2 million) increased. At the same time, the Group reported a decrease in costs of damages and fines (by PLN 1.8 million) which was related to the fine paid in 2015 when the decision of the President of the Office for Competition and Consumer Protection No. DAR 15/2006 on fining banks for joint determination of the “interchange” rate entered info force.
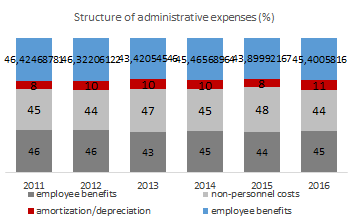
General and administrative expenses
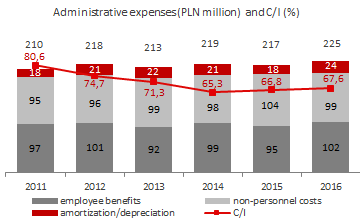
In 2016, the bank’s general and administrative expenses amounted to PLN 224.9 million and were by 3.6% higher comparing to 2015.
| Administrative expenses and amortization/depreciation of the Bank Pocztowy Capital Group (PLN’000) | ||||||
|---|---|---|---|---|---|---|
| Change 2016/2015 | ||||||
| 2016 | Structure (2016) |
2015 | Structure (2015) |
PLN ‘000 | % | |
| Administrative expenses including amortization/depreciation | (224 898) | 100,0% | (217 030) | 100,0% | (7 868) | 3,6 % |
| Employee benefits | (102 105) | 45,4% | (95 276) | 43,9% | (6 829) | 7,2 % |
| Non-personnel costs | (98 909) | 44,0% | (103 576) | 47,7% | 4 667 | (4,5)% |
| Amortization/depreciation | (23 884) | 10,6% | (18 178) | 8,4% | (5 706) | 31,4 % |
Employee benefits constituted the key cost item in 2016. In 2016 they amounted to PLN 102.1 million, having grown by 7.2% comparing to 2015. The increase in expenses resulted from higher salaries of the sales network staff (implementation of a new career path in the second quarter of 2015) and an increased provision for unused paid vacation and recognition of provisions for costs of non-competition agreements of Members of the Management Board of the 9th term of office.
In 2016 operating expenses reached PLN 98.9 million and were 4.5% lower than in 2015. As for non-personnel expenses, costs of payments to the Bank Guarantee Fund decreased the most, as apart from the mandatory fee and the prudential fee these costs included amounts used by the Bank Guarantee Fund for payment of guaranteed funds:
- PLN 0.8 million in 2016 - amount used for payment of guaranteed funds to depositors of Bank Spółdzielczy in Nadarzyn under Resolution of the Management Board of Bank Guarantee Fund no. 308/DGD/2016;
- PLN 11.9 million in 2015 - amount used for payment of guaranteed funds to depositors of Spółdzielczy Bank Rzemiosła i Rolnictwa in Wołomin under Resolution of the Management Board of Bank Guarantee Fund no. 87/DGD/2015.
PMoreover, in 2016 non-personnel expenses were increased by the tax on certain financial institutions, which amounted to PLN 4.8 million in 2016.
In 2016 amortization expenses amounted to PLN 23.9 million and were by PLN 31.4% higher than in 2015. The growth resulted from higher investment expenditure resulting from the development of the Group and modernization of IT solutions.
Administrative expenses (PLN million) and C/I(%)
Structure of administrative expenses (%)
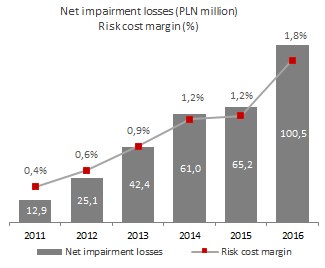
Net impairment losses
In 2016 costs of recognition of impairment losses reached PLN 100.5 million and were by 54.2% higher than a year before, as in 2015 they had amounted to PLN 65.2 million. This item was affected by higher impairment losses on loan receivables with indications of impairment (mostly personal loans), where the impairment loss amount was by PLN 44.3 million, i.e. 75.5% higher than in 2015. The increase resulted from changes in the cash loan and installment loan portfolio with a higher impairment loss (PLN 82.2 million) and higher IBNR loss (PLN 13.8 million) in 2016.
Net impairment losses (PLN million)
Risk cost margin
Impairment loss on loans for individuals grew for the following reasons:
- increase in the value of the loan portfolio with recognized impairment, which results from shifting loans granted in 2013-2016 on vintage curves (portfolio maturity) with a higher curve slope than in curves from previous years,
- risk profile of the portfolio of cash loans and installment loans for years 2013-2016 higher than initially assumed,
- increase in the indicator showing the portfolio coverage with observable inputs in the banking sector.
These factors increase the risk ratios (including PD and LGD ), which are regularly reviewed by the Bank based on actual portfolio changes and which are related to IBNR losses.
In 2016 the amount of impairment losses recognized in loans granted to institutions was by PLN 9.0 million lower than in 2015, which resulted from the release of a portion of impairment losses related to the situation in the portfolio which was better than expected (sale of NPL portfolio).
| Net impairment losses (PLN’000) | ||||||
|---|---|---|---|---|---|---|
| 2016 | 2015 | Total change 2015/2016 | ||||
| Total | including IBNR | Total | including IBNR | PLN ‘000 | % | |
| Loans and advances granted to clients, including: | (100 496) | (11 817) | (65 158) | (2 149) | (35 338) | 54,2 % |
| individuals | (102 931) | (13 762) | (58 639) | (3 427) | (44 292) | 75,5 % |
| overdraft facilities | (183) | 35 | (741) | 109 | 558 | (75,3)% |
| cash loans and installment loans | (95 980) | (13 784) | (53 032) | (4 792) | (42 948) | 81,0 % |
| mortgage loans | (5 513) | (100) | (2 874) | 106 | (2 639) | 91,8 % |
| real estate loans | (709) | 126 | (1 722) | 1 047 | 1 013 | (58,8)% |
| credit card debt | (546) | (39) | (270) | 103 | (276) | 102,2 % |
| institutional clients | 2 456 | 1 966 | (6 567) | 1 275 | 9 023 | (137,4)% |
| local government | (21) | (21) | 48 | 3 | (69) | (143,8)% |
Performance in operating segments
Information regarding operating segments is reported on the same basis as is used internally in reports presented to the Management Board of the Bank for the purpose to allocate resources to segments and evaluate their performance.
Income per operating segment (PLN million)
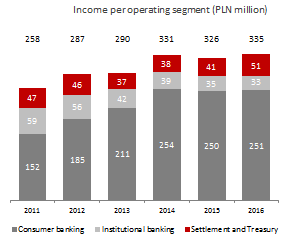
For management purposes, the Group’s operations have been divided into segments in accordance with products sold, services provided and types of clients. The following operating segments have been identified: consumer, institution, settlement and treasury.
Dividend income has been allocated to the settlement and treasury segment in information regarding consolidated income statement for the year ended 31 December 2016. The performance data for 2015 have been restated to ensure comparability.
Consumer segment
From management accounting perspective the consumer segment offers products targeted at individuals and microenterprises (individuals carrying out business activities). The offer consists of saving and settlement accounts, savings accounts, term deposits, consumer loans (including cash loans and overdrafts), mortgage loans (including housing loans and mortgages), debit and credit cards, insurance products and investment funds. It is sold through traditional distribution channels in a countrywide network of branches and sales points (including the sales network of Poczta Polska and financial agents), Pocztowy24 Internet banking, PocztowySMS service and a Contact Center.
In 2016 the consumer segment generated gross profit of PLN (39.5) million vs. PLN 6.4 million in 2015, mainly due to a growth in impairment losses on loans and advances (mostly on consumer loans).
Gross profit in consumer segment in 2016 (PLN million)
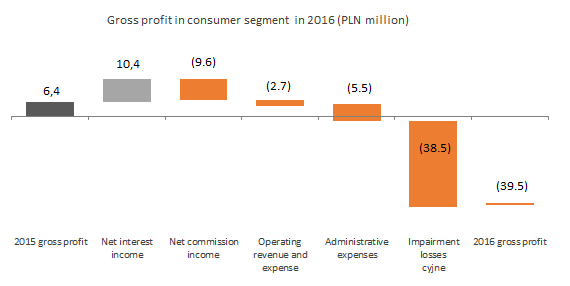
Key gross profit drop drivers in the consumer segment:
- An increase in net interest income. Net interest income constituted the key source of segment income. It amounted to PLN 231.2 million and increased by PLN 10.4 million as interest rates remained low and reduced costs generated on deposits from 1.3% in 2015 to 1.0% in 2016.
- A decrease in the net commission income. The consumer segment made PLN 19.8 million on fees and commissions, which denotes a PLN 9.6 million drop vs. the prior year. Key drop drivers included: a provision recognized for refund of investments to clients related to proceedings instigated by Office for Competition and Consumer Protection, reduced commissions on the maintenance of current accounts, and lower income on cash transactions, Infokonto service, as well as an increase in costs of cash and credit cards arising from a growing number of issued cards (due to growing popularity of contactless card transactions and development of the acceptance network).
- Higher administrative expenses. In 2016 the consumer segment costs reached PLN 183.6 million, which denotes a PLN 5.5 million growth year-on-year. Assigning additional non-personnel expenses to the consumer segment (the cost of the so-called banking tax), an increase in personnel expenses in the sales support area and the recognized provisions for unused annual leave were the key growth factors.
- Higher net impairment losses. In 2016 it reached PLN 102.6 million vs. PLN 64.1 million in 2015 as a result of a growth in impairment losses on loan receivables with indications of impairment (mostly cash and installment loans originated in 2013-2016).
Institutional segment
For management accounting purposes institutional segment includes operating profit/loss from services provided to business entities with legal personality, individuals and entities with no legal personality carrying out business activities under applicable regulations and central and local administration entities. The Group’s offer for these clients includes credit and deposit products and settlement services with products aimed at improving cash management efficiency. The products are offered both through Bank’s own network and that of Poczta Polska.
Gross profit in institutional segment in 2016 (PLN million)
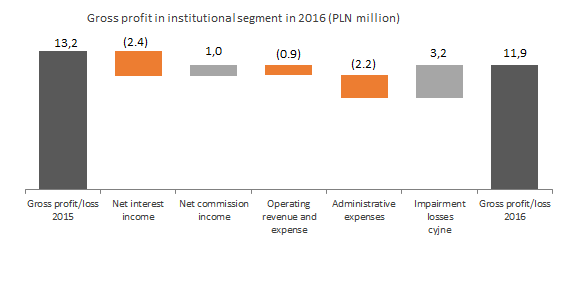
In 2016 the institutional segment generated a gross profit of PLN 11.9 million versus PLN 13.2 million in 2015 (a decrease of PLN 1.3 million).
The institutional segment profit was driven by the following items:
- A decrease in net interest income. The segment generated PLN 21.4 million, which denoted a PLN 2.4 million decrease year-on-year, mostly as a result of reducing the scope of loan and deposit operations in this segment, in accordance with the strategy.
- An increase in net fee and commission income. The segment generated a net commission income of PLN 12.2 million, i.e. by PLN 1.0 million more (i.e. by 8.9%) than in the prior year. The highest increase in commission income resulted from opening and maintaining bank accounts for sole proprietors, sealed deposits and Giro Płatność orders.
- A growth in administrative expenses. They amounted to PLN 22.9 million, i.e. PLN 2.2 million more than in the prior year, as a result of a growth in personnel expenses, i.e. severance paid to some Management Board members of 9th office term, and increased depreciation and amortization arising from Bank’s growth and improvement of the existing IT solutions allocated to the segment.
- Improvement in net impairment losses. In 2016 they were positive and amounted to PLN 2.2 million vs. PLN (1.0) million in 2015 as a result of a gain on sales of a group of loan receivables.
Settlement and treasury segment
Settlement and treasury segment in management accounting includes:
- Gain/loss on operating activities covering settlement services. Key settlement services include: processing documents regarding social insurance and tax payments; cashless transfers of social insurance benefits to beneficiaries and cash payments included in interbank settlements.
- Gain or loss on financial instruments measured at fair value through profit or loss, gain or loss on foreign exchange transactions and gain or loss on other financial instruments.
- Net interest income. The figure includes transactions in the interbank market (e.g. deposits), purchases and sales of securities (Treasury bonds, debt instruments issued by the National Bank of Poland, bank bonds), as well as sell-buy-back and buy-sell-back transactions and derivative transactions such as FRA, IRS or swap. Client funds obtained by operating segments are repurchased at a transfer rate and the funds to finance their credit operations are sold to these segments.
In 2016 the settlement and treasury segment generated a gross profit of PLN 34.7 million versus PLN 25.5 million in 2015 (an increase of approx. 36.0%).
Gross profit of settlement and treasury segment in 2016 (PLN million)
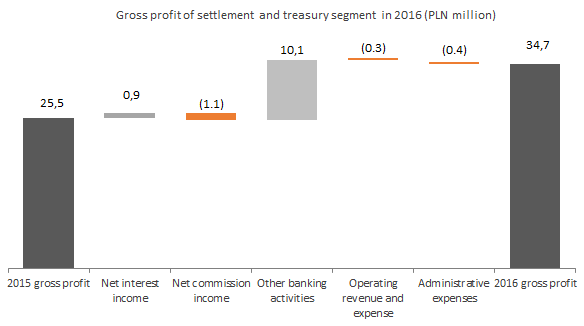
The key gross profit drivers in the settlement and treasury segment in 2016:
- An increase in net interest income. It amounted PLN 12.4 million and was PLN 0.9 million higher than in the prior year
- A decrease in net fee and commission income. It amounted to PLN 14.4 million and was PLN 1.1 million (7.0%) lower than in the prior year. The drop was seen mostly with regard to income generated from social insurance premium transfers and Wpłaty Standard.
- An increase in other net banking income. The item includes: gain or loss on financial instruments measured at fair value through profit or loss, gain or loss on foreign exchange transactions and dividend. Gain or loss on other financial instruments amounted to PLN 23.6 million vs. PLN 13.5 million in 2015 as a result of generating income on sales of shares in VISA Europe to VISA Inc. (the acquisition of VISA Europe by VISA Inc.). As a result of the transaction, the Group recognized income of PLN 16.9 million.
- A slight increase in administrative expenses. In 2016, the segment generated costs of PLN 15.4 million vs. PLN 15.0 million in 2015.
Key performance ratios
| PKey performance ratios of the Bank Pocztowy S.A. Capital Group | |||
|---|---|---|---|
| 31.12.2016 | 31.12.2015 | Change 2016/2015 |
|
| Net ROE (%)1 (%) | 0,5 | 6,9 | (6,4) p.p. |
| Net ROA (%)2 (%) | 0,04 | 0,5 | (0,46) p.p. |
| Costs including amortization / income (C/I)3 (%) | 67,6 | 66,8 | 0,8 p.p. |
| Net interest margin (%)4 (%) | 3,7 | 3,6 | 0,1 p.p. |
| CAR (%)5 (%) | 14,4 | 14,4 | 0,0 p.p. |
| NPL – the share of impaired loans and advances in the credit portfolio6 (w %) | 8,9 | 7,0 | 1,9 p.p. |
1.Net ROE calculated as a net profit for the period from 1 January 2016 to 31 December 2016 to average equity (calculated as the average of equity at the end of a given year and at the end of the previous year) taking into account the net profit for a given year.
2. Net ROA calculated as a net profit for the period from 1 January 2016 to 31 December 2016 to average assets (calculated as the average of assets at the end of a given year and at the end of the previous year).
3. Costs including amortization and depreciation/Income (C/I) calculated as the general and administrative expenses including amortization and depreciation to total income (net interest income, net fee and commission income, gain/loss on financial instruments measured at fair value through profit or loss, gain/loss on foreign exchange transactions, gain/loss realized on other financial instruments, other operating revenue and expenses).
4. Net interest margin calculated as a relation of net interest income for a given period to average assets (calculated as average daily balance of assets). Net interest margin calculated based on two average assets balances: at the end of the current year and of the prior year) amounts to 3.8% for 2016 and 3.4% for 2015.
5. CAR and Tier 1 values have been calculated in accordance to the Regulation (EU) no. 575/2013 of the European Parliament and of the Council of 26 June 2013 on prudential requirements for credit institutions and investment firms. Separate data.
6. The share of loans with recognized impairment (NPL) in the loan portfolio, calculated as a relation of loans with recognized impairment to total (gross) loans and advances granted to customers.
In 2016 the Group generated net ROE of 0.5%, which denoted a year-on-year drop by 6.4 p.p., due to a decrease in net profit.
A growth in income (by 3.5% y/y) accompanied with an increase in operating expenses (by 3.6% y/y) translated into a slight deterioration in Cost/Income ratio (C/I) ratio. In 2016 C/I ratio amounted to 66.8%, i.e. was by 0.8 p.p. higher than in 2015.
At the end of 2016 the share of loans with recognized impairment (NPL) in the credit portfolio was 8.9% vs. 7.0% a year before. The 1.9 p.p. increase resulted mostly from a growth in Group’s exposure concentration on cash and installment consumer loans and the portfolio reaching its maturity. The carrying amount of cash and installment loans with recognized impairment increased in 2016 by PLN 107.6 million (from PLN 185.6 in 2015 to PLN 293.2 million in 2016).
Statement of financial position of the Capital Group as at 31 December 2016: key balance sheet items
As at 31 December 2016 the balance sheet total of the Group amounted to PLN 6,936.6 million and was by PLN 276.5 million, i.e. by 3.8% lower than at the end of 2015.
Assets
The following changes occurred in the structure of Group’s assets in 2016:
- The balance of cash and cash equivalents in the Central Bank decreased. It amounted to PLN 65.4 million, i.e. PLN 361.5 million less than in December 2015, mainly as a result of a drop in clients’ funds (including Poczta Polska S.A.) and in funds obtained on the interbank market. Consequently, their share in assets decreased from 5.9% at the end of 2015 to 0.9% in 2016.
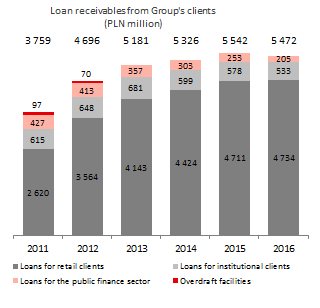
- The value of the key item in the Group’s assets, i.e. net loans and advances granted to clients decreased. As at 31 December 2016 they amounted to PLN 5,154.3 million and dropped by PLN 158.5 million during the year. They accounted for 74.3% of Group’s total assets (vs. 73.6% at the end of 2015).
- The value of investments in financial assets increased. They amounted to PLN 1,464.6 million vs. PLN 1,248.0 million as at 31 December 2015. As at 31 December 2016, investments in financial assets increased by PLN 216.6 million (17.3%) vs. 31 December 2015, mostly due to an increased investment of the Group in Treasury bonds.
Loan receivables from Group’s customers
(PLN million)
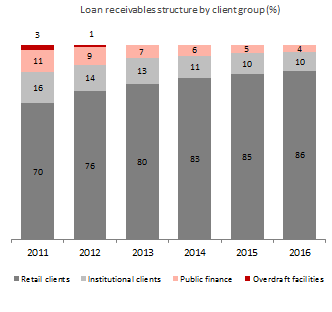
Loan receivables structure by customer group
(%)
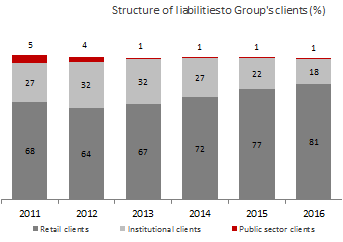
Equity and liabilities
The following changes occurred in the structure of Group’s equity and liabilities in 2016:
- Liabilities from securities sold under repo and sell-buy-back agreements decreased. As at 31 December 2016 they amounted to PLN 1.0 million vs. PLN 154.0 million at the end of 2015. Sell-buy-back and repo transactions were concluded on Treasury bonds.
- The value of liabilities due to issue of debt securities increased. As at 31 December 2016 they amounted to PLN 355.6 million vs. PLN 503.5 million at the end of 2015. Liabilities from issues of debt securities decreased by PLN 147.9 million (29.4%) as a result of redemption of B2 series ordinary bonds.
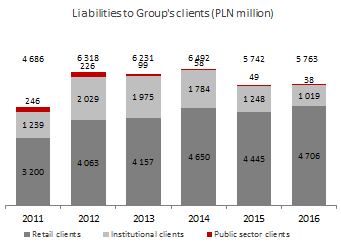
Liabilities to Group’s customers(PLN million)
Structure of liabilities to Group’s customers (%)